Full Page Load Feature in Proberix
The Full Page Load feature in Proberix is available for HTTP(S) probes, providing an in-depth assessment of how long it takes for a web page to load fully, from the initial request to the completion of all resources necessary for the page to function as intended. This feature is essential for monitoring the user experience, particularly for performance-sensitive applications where load times can significantly impact user satisfaction and engagement.
How It Works
When the Full Page Load feature is enabled for an HTTP(S) probe, Proberix goes beyond performing basic checks that only request a single resource. Instead, it simulates a full browser execution, meaning it downloads and renders all resources required by the webpage, just as a real user’s browser would.
During this process, all the same basic metrics that are collected for a standard HTTP(S) probe (such as DNS time, Wait time, TCP time, First Byte time, Download time, and overall Response Time) are also gathered for the document resource.
Additional Metrics
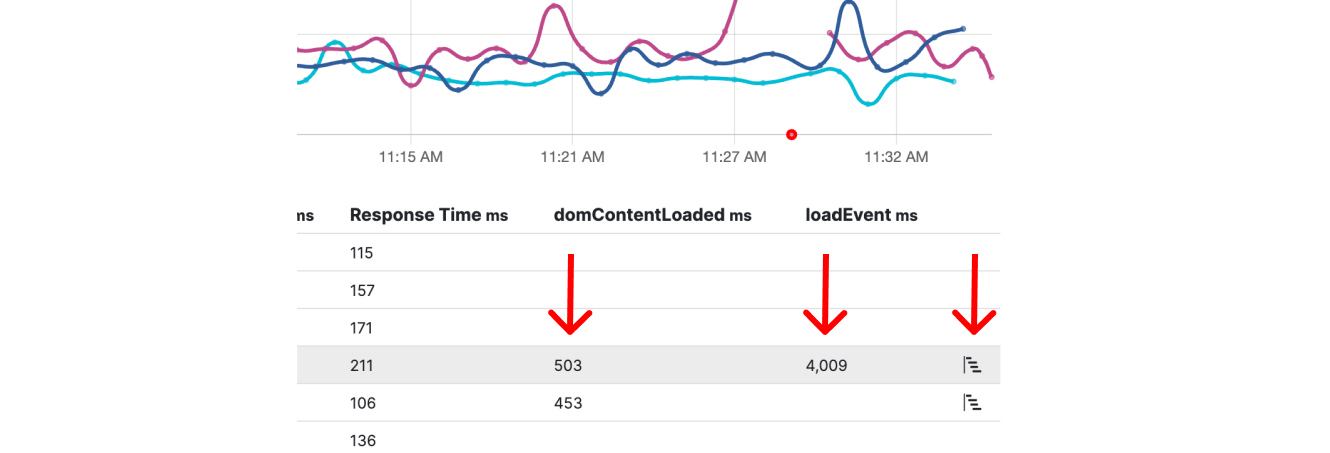
When using the Full Page Load feature, the following additional metrics are displayed in the table view:
-
domContentLoaded Time: This metric represents the time it takes for the DOM (Document Object Model) to be fully loaded and parsed, excluding stylesheets, images, and subframes. This is a critical metric for understanding how quickly the basic structure of the page is ready for user interaction.
-
loadEvent Time: This metric indicates the time it takes for the entire page, including all resources such as images, scripts, and stylesheets, to be fully loaded. It reflects the total load time experienced by the user.
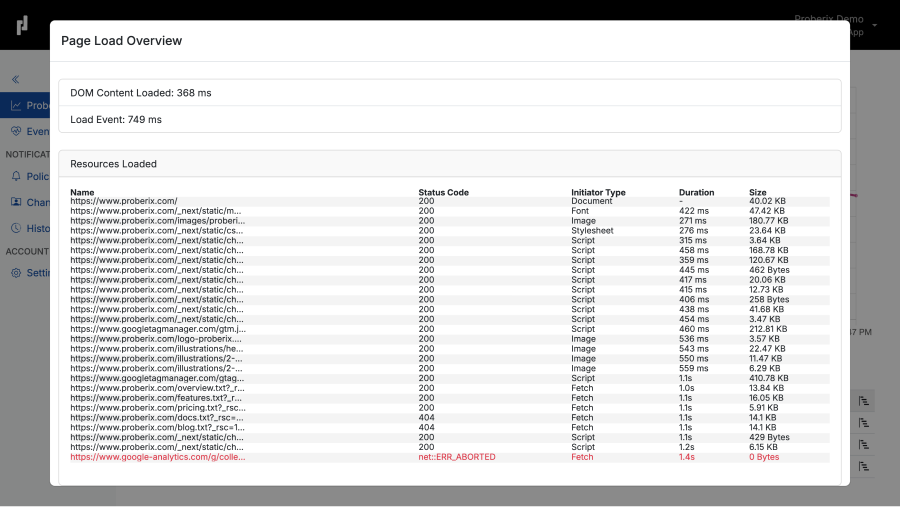
Additionally, an icon will appear in the table view that allows you to open detailed resource timings. This view provides a breakdown of how long each individual resource took to load, offering a granular look at the components contributing to the overall page load time.
Enabling the Full Page Load Feature
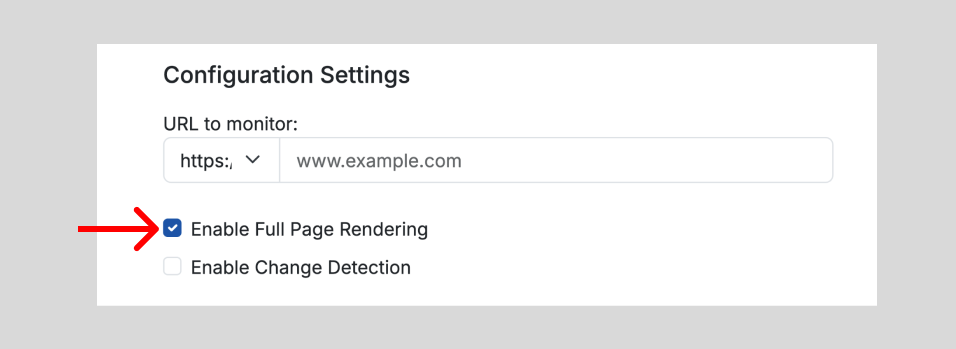
To enable the Full Page Load feature for a probe, simply check the Enable Full Page Rendering checkbox in the Probe Settings.
Impact on Monitoring Interval
When the Full Page Load feature is enabled, the available monitoring intervals change. Due to the heavier processing required to simulate full page rendering, the monitoring interval options are adjusted to range from 10 minutes to 50 minutes, instead of the usual 1 to 5 minutes.
By enabling the Full Page Load feature, you can gain deeper insights into your website’s performance, ensuring that you capture the full user experience, especially in scenarios where load time is critical to user satisfaction.